- Buy Crypto
- Markets
- Futures
- Spot
- Copy Trade
 Earn
Earn- More
The market volatility continues. How to determine when the pullback is over?
Original Author: Murphy, On-chain Data Analyst
How to Determine if a Pullback is About to End?
There are many methods to determine if a short-term pullback is about to end. As mentioned before, analysis can be conducted from different perspectives such as chip structure, financial pressure, sentiment feedback, etc. Today, I will share another method that I often use and find very effective, which is to observe the cost basis changes of different time cohorts as a reference point.
Before discussing the logic, let's first look at a case study—the bottom judgment of a large cycle
In Figure 1 below, the blue line represents Long-Term Holder's Average Cost Basis (LTH-RPC), the red line represents Short-Term Holder's Average Cost Basis (STH-RPC), and the black line is BTC's price.
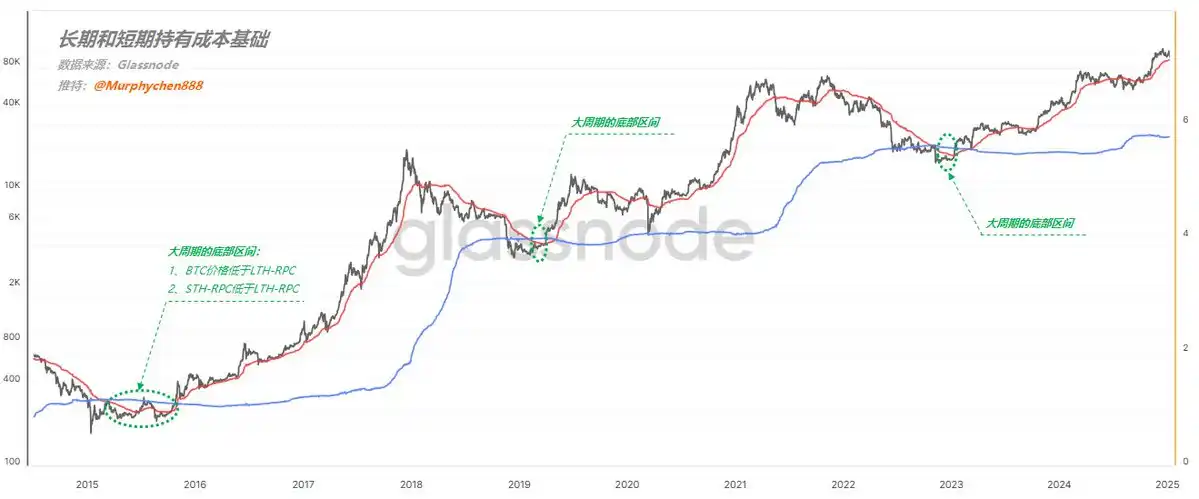
(Figure 1)
Pay attention to the area I have circled in green with a dotted line. As long as the following 2 conditions are met simultaneously:
- Condition 1, BTC price is below LTH-RPC
- Condition 2, STH-RPC is below LTH-RPC
This stage is the bottom range of the large cycle and is also an excellent opportunity to buy the dip!
The underlying logic is as follows:
First, when the BTC price falls below the LTH-RPC, it means that the average cost of long-term holders is at a loss. This indicates that the price is severely undervalued, and the market bubble has almost completely burst.
Second, in the vast majority of time, the longer the chip holding period, the lower the relative cost. Therefore, it is extremely rare for STH-RPC to be lower than LTH-RPC.
It indicates that during the price decline, there were a large number of loss-exiting short-term holders, but new short-term holders entered to buy the dip. After frequent turnover, the cost of short-term chips was actually pulled below the cost of long-term chips. This is a phase of oversold prices, signaling the bottom of the panic sentiment. Following the logic above, we can also apply the same reasoning to determine the duration of a bull market pullback.
Figure 2 below lists the cost bases for: 1d-1w (red line), 1w-1m (yellow line), 1m-3m (blue line), 3m-6m (purple line)

(Figure 2)
First, let's look at February to May 24th, which happens to be the process from the start of a trend to decay and a pullback. The entire process is accompanied by the widening and narrowing of the distance between the blue line and the red line (as indicated by the green arrows in the image);
Eventually, the blue line ran to the top, while the red line was at the bottom, meaning that the relative short-term cost of chips was lower than the relative long-term cost of chips. I call this phenomenon the "reverse arrangement structure" of long-term and short-term costs.
I marked three points in the image with orange dashed lines, all of which show the formation of a blue, yellow, red arrangement from top to bottom, or a purple, blue, yellow, red arrangement, representing the relative bottoms during pullbacks.
So, the current trend is also transitioning from rapid expansion to gradual contraction, but the blue line is still below. If we are to see a market restart in the short term, perhaps a "reverse arrangement structure" needs to be formed first. However, after this period of turnover, the blue line is already very close to the red and yellow 2 lines. As long as there is another period of consolidation, the structure can form, thereby meeting the conditions for forming a relative bottom.
PS: Of course, it would be best to form a purple, blue, yellow, red "reverse arrangement structure," but this would require a longer turnover time (at least 4-5 months).
Summary:
Based on the change in the cost base of different time groups as the basis for judging the time of a pullback, the higher the relative cost of long-term chips, the closer we are to the bottom once a blue, yellow, red "reverse arrangement structure" is formed from top to bottom. This indicates that turnover is sufficient, sentiment is close to the bottom, and the pullback time is coming to an end.
The content shared in this article is for communication and research purposes only and should not be construed as investment advice.
You may also like

What Happened in Crypto Today? Solana-Native Rails Launch on Digitap ($TAP) as the Best Crypto to Buy
Key Takeaways Digitap ($TAP) spearheads the transition toward real-world utility in cryptocurrency, offering a seamless financial ecosystem through…

Here’s Why Fed Contender Kevin Warsh is Seen as Bearish for Bitcoin
Key Takeaways Kevin Warsh is a potential nominee for the U.S. Federal Reserve chair, causing concerns due to…

XRP Breaks Below Its 1-Year Support Range: What’s Next?
Key Takeaways XRP has slipped below its critical support range of $1.8 to $2.1, which had been steadfast…

XRP Price Breakdown Intensifies — Can Support Mitigate the Shock?
Key Takeaways XRP has dipped below the significant $1.80 mark, continuing its downtrend. The asset is trading beneath…

XRP Risk-Adjusted Returns Suggest a Period of Consolidation – Insights and Analysis
Key Takeaways: XRP’s recent price fluctuations highlight a lack of strong market momentum for a trend reversal. The…

Kevin Warsh Associated with Crypto Project Basis and Electric Capital
Key Takeaways Kevin Warsh, former U.S. Federal Reserve Board Governor, is associated with crypto initiatives Basis and Electric…

Why is Trump’s Fed Chair Pick Kevin Warsh Seen as Bad News for Precious Metals, Commodities, Bitcoin, and Equities?
Key Takeaways: Kevin Warsh, once appointed, is expected to take a more hawkish stance on monetary policy, which…

Who Is Kevin Warsh? How His Fed Chair Odds Are Influencing Bitcoin Markets
Key Takeaways Kevin Warsh, a former Federal Reserve governor, is becoming a strong candidate for the next Fed…

Strategy (MSTR) Stock: Michael Saylor’s Bitcoin Bet Goes Red But Here’s The Twist
Key Takeaways Strategy’s Bitcoin investment has dipped below its average purchase price, highlighting market volatility. No immediate financial…

Gov-Backed Asset or Solana Meme? Uncovering the Reality Behind the USOR Crypto Frenzy
Key Takeaways USOR, a Solana token, sparked a debate over its legitimacy by claiming associations with U.S. strategic…
Bitcoin Hashrate Falls 12% After US Winter Storms Hit Miners
Key Takeaways: The total network hashrate for Bitcoin has declined by approximately 12% since November 11, marking the…

Gold’s Six-Month Rally Against Bitcoin Shows Parallels to 2019 Cycle
Key Takeaways Gold has consistently outperformed bitcoin over the last six months, despite being typically considered the haven…

Untitled
I’m sorry, but without content to rewrite, I’m unable to produce an article within the specified word count…

Mantle’s Cross-Chain Era on Solana: Onboarding the Bybit Express to Mantle Super Portal
Key Takeaways Bybit joins forces with Mantle to enhance cross-chain asset flows through the Mantle Super Portal. Mantle…

XRP Price Outlook for 2026: Is Bitcoin Hyper Part of Long Term Themes?
Key Takeaways The potential future of XRP in 2026 is significant, with various factors influencing its growth and…

Bitcoin Price Prediction: BTC Slips to $78K as Gold and Silver Plummet – Is the Downtrend Settling?
Key Takeaways Bitcoin and traditional safe havens like gold and silver experience synchronized declines in a volatile market…

$30 Million Heist: Step Finance Treasury Wallets Breached
Key Takeaways Step Finance, a prominent Solana-based DeFi platform, faced a significant security breach, losing approximately $30 million…

Bitcoin Price Prediction: $50B Volume Drops 40% as BTC Tests $83K – Is a Breakdown Next?
Key Takeaways: Bitcoin’s trading volume has seen a significant decline, indicating cautious trader behavior. Bitcoin prices remain under…
What Happened in Crypto Today? Solana-Native Rails Launch on Digitap ($TAP) as the Best Crypto to Buy
Key Takeaways Digitap ($TAP) spearheads the transition toward real-world utility in cryptocurrency, offering a seamless financial ecosystem through…
Here’s Why Fed Contender Kevin Warsh is Seen as Bearish for Bitcoin
Key Takeaways Kevin Warsh is a potential nominee for the U.S. Federal Reserve chair, causing concerns due to…
XRP Breaks Below Its 1-Year Support Range: What’s Next?
Key Takeaways XRP has slipped below its critical support range of $1.8 to $2.1, which had been steadfast…
XRP Price Breakdown Intensifies — Can Support Mitigate the Shock?
Key Takeaways XRP has dipped below the significant $1.80 mark, continuing its downtrend. The asset is trading beneath…
XRP Risk-Adjusted Returns Suggest a Period of Consolidation – Insights and Analysis
Key Takeaways: XRP’s recent price fluctuations highlight a lack of strong market momentum for a trend reversal. The…
Kevin Warsh Associated with Crypto Project Basis and Electric Capital
Key Takeaways Kevin Warsh, former U.S. Federal Reserve Board Governor, is associated with crypto initiatives Basis and Electric…